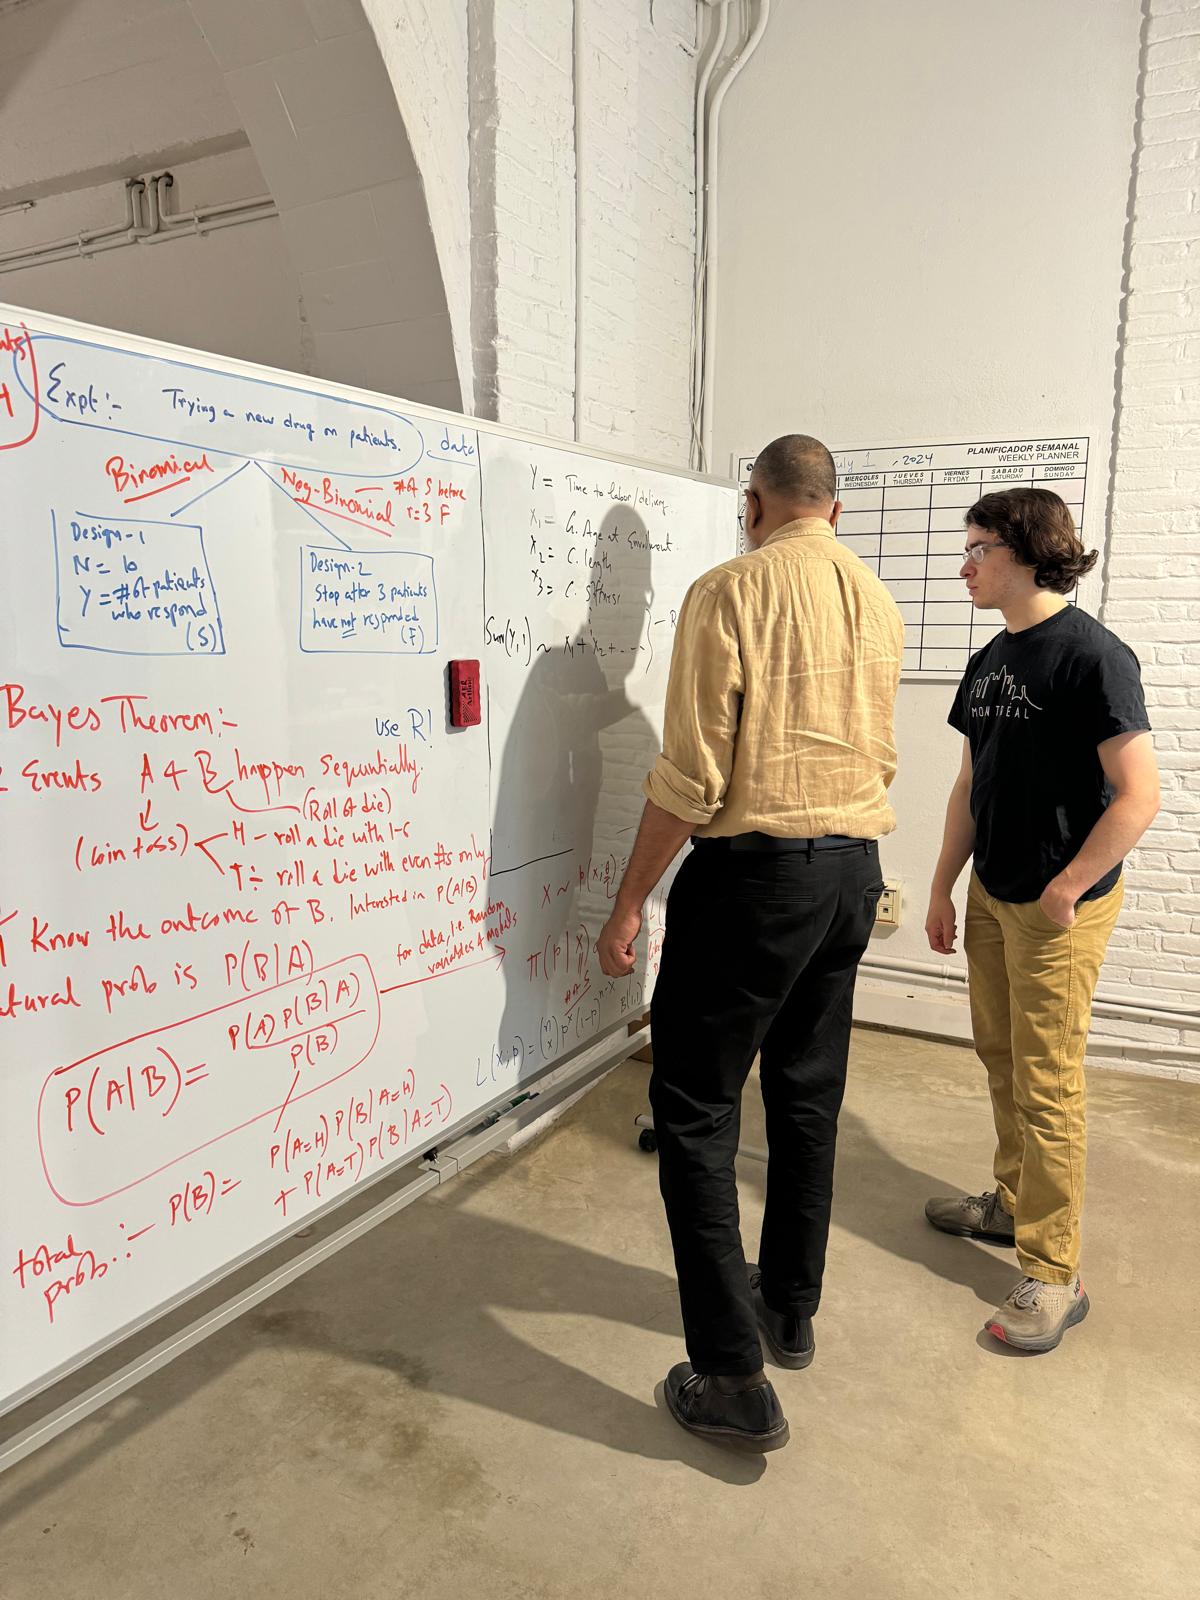
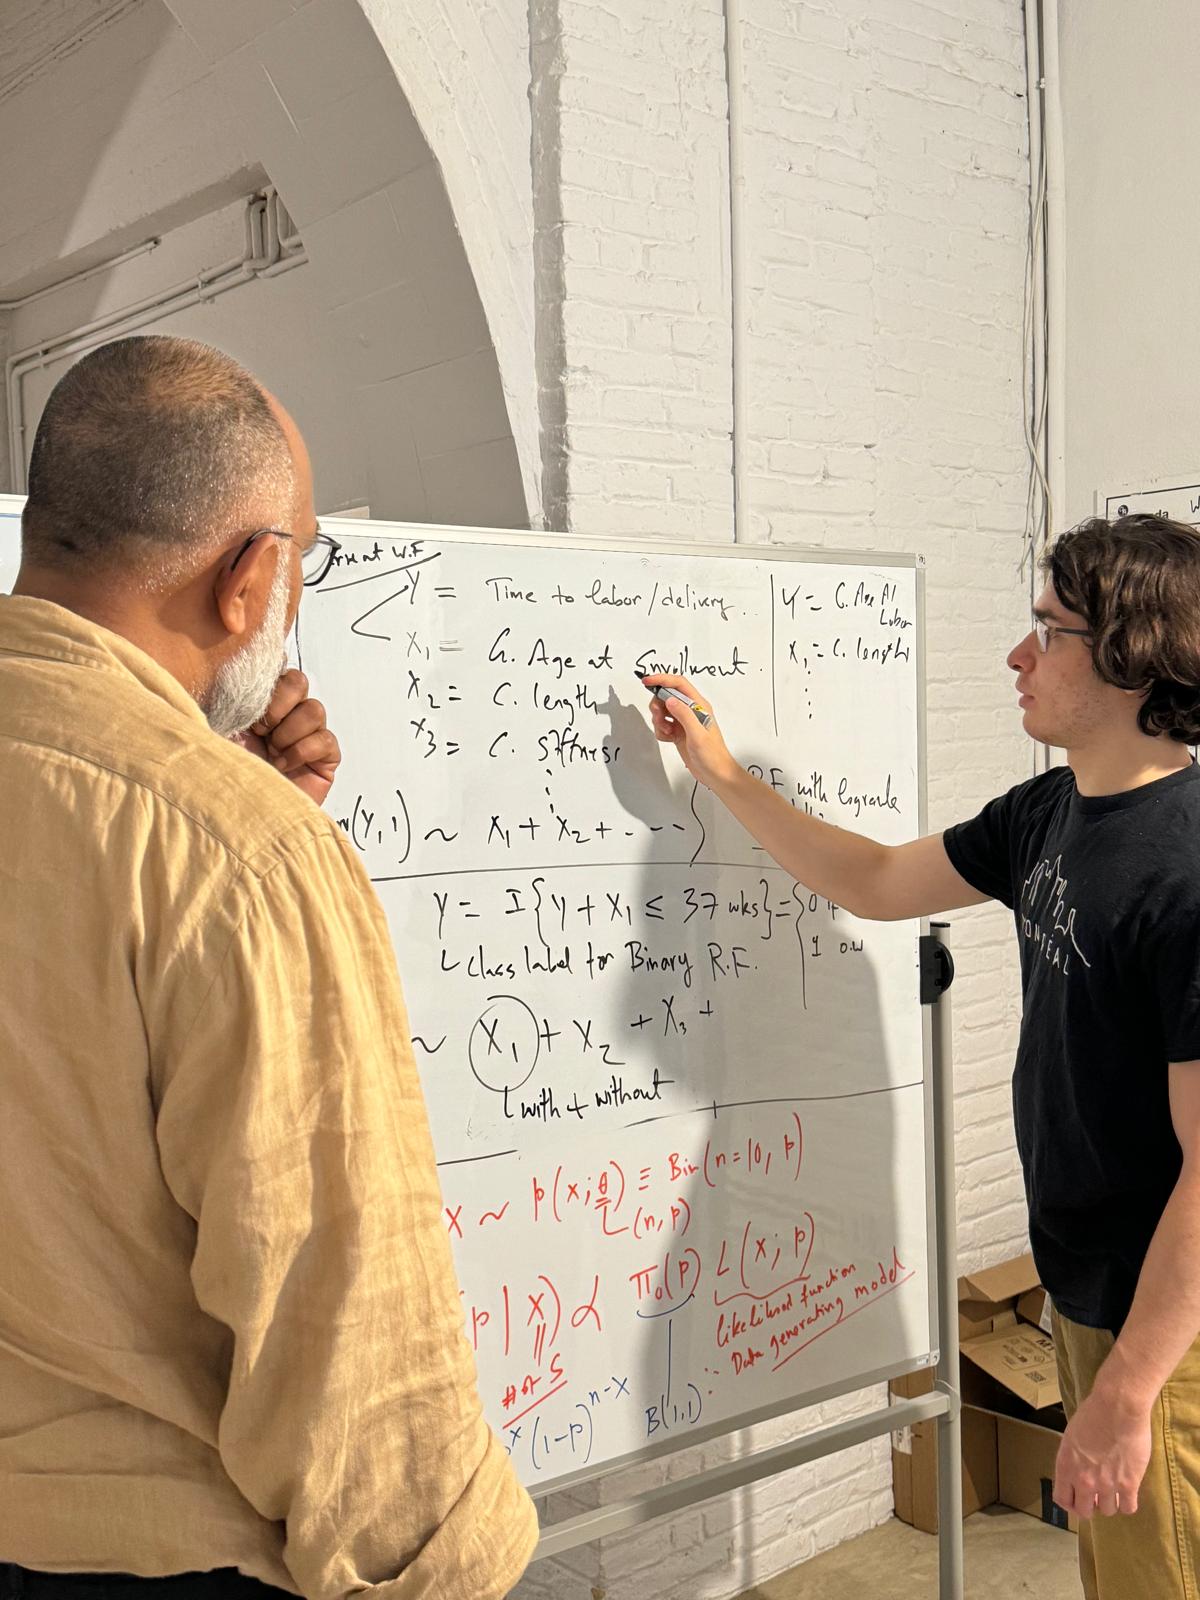
I was fortunate enough to have the opportunity to undertake an internship with MuSigmas for around 4 months this year. Although my primary interest in statistics was more related to economics and social science methods, I was eager for any chance to improve my statistical and data analytical skills. Furthermore, this was the perfect opportunity to get some real-world experience working in data analysis, through which I could also gauge my interest in it as a future career, specifically in the drug development sector.
Exploring Bayesian and Frequentist Methods
At the beginning of my internship, Rajat set me an exercise to introduce me to the conceptual differences between frequentist and Bayesian methods, as I had only previously studied the former. I was asked to consider two study designs to research the response rate of a drug: one with a fixed sample size of 10 patients, counting the number of patients who responded positively to the drug, the other with a fixed number of non-responses, counting the number of patients until you achieve 3 non-responses. Whichever study design is chosen, the data is the same: PNPPPPNPPN. The null hypothesis is that probability of response p <= 0.5, and the alternate hypothesis is that p > 0.5.
Rajat then asked me two questions:
- What is the p-value for each design?
- Given a prior distribution of Beta(1,1), and the data, what is the probability that the hypothesis is true on your posterior distribution for each design?
The point of this exercise was to emphasise a key element of the difference between a Bayesian and a frequentist approach to p-values. If you calculate the answers to the questions, the p-values are significantly different, whilst the probability under the Bayesian method is the same – the data, not how you frame the study question, determines the strength of your hypothesis. This is not to dismiss frequentist statistics, which are absolutely useful, but to highlight some of the key distinctions in adaptive approaches to study designs.
Creating Graphics for Statistical Communication
Next, I was asked to work on a number of graphics to illustrate some statistical concepts for Rajat’s work communicating study design to clinicians. I was asked to create a graphic in R using ggplot, showing how the posterior probability of a hypothesis that a vaccine has a given efficacy (or greater) would evolve as a function of sample size. Interim assessments to trial data are a key element of much of the consulting work at MuSigmas in order to decide on possible prespecified changes to the design (early stopping for futility/ efficacy, increase sample size, enrich population, etc.) is an exceptionally useful strategy in drug development.
Developing a Machine Learning Model
It was at this point that Rajat introduced me to the largest and longest project I would work on over my internship here: the development of a machine learning model to attempt to predict how far a patient was from a physiological event. The client had developed a medical device which took various measurements, and the theory was that with these measurements, as well as demographic and health data about a patient, we would be able to predict the risk of occurence of the event of interest. We ran a Random-Forest model incorporating a Cox Proportional Hazards regression model to obtain a general idea of which predictors would be most important.
Visualizing Group Sequential Concepts
Whilst we waited for responses to our questions about the data set, Rajat asked me to visualise a graph of how a Wald-type test statistic would develop over sequential interim looks as a study took place in three scenarios: Where the probability of a response from treatment was 0.1 higher than the control, where the probability was the same, and where the probability was 0.1 lower. Theoretically, the test statistic should follow Brownian motion. I graphed this three times for each scenario, with a final sample size of 300 in each. We also added efficacy and futility bounds derived using the/an O’Brien-Fleming type alpha-spending function, whereby a study would be stopped if the test statistic crossed those bounds, with the bounds becoming less extreme as the sample size increased. There are various alpha-spending functions that are in use in order to protect from type-I error inflation that would otherwise happen due to testing the same hypothesis multiple times with evolving data.
Returning to Machine Learning and Model Tuning
Finally, I returned to the machine learning project. We took the approach of using a random forest model, first to identify the predictors with the highest relative importance, but then to begin building a predictive model that could predict our response variable given the predictors for new data. This involved further cleaning up of the data, and then beginning to narrow down which variables we included in the model – including removing one variable of a pair that were highly correlated and thus were not both providing useful information about the response variable. Here is one of the many graphs of relative importance for each variable that I produced over the project, each boxplot being a variable:
A key element of the model was our test-training split. We split the test and training data into a 30:70 ratio but, in order to avoid the peculiarities of any one particular split affecting our result, averaged our results over many hundreds of trials – each boxplot in the graph above is a variable-wise distribution of the importance measure across these random data partitions.
Conclusion and Reflections
Overall, my time at MuSigmas has been an incredibly rewarding learning experience. I have significantly improved my skills in R, laid the foundation for my data analysis skills and broadened my knowledge of both statistics and generally how a real workplace functions. I have really enjoyed working on something that has a concrete, real-world impact, which has been such a clear contrast to the much more theoretical working that I’m used to from school. Most of all, I’ve enjoyed learning from and working with my coworkers. Going forwards, I will be studying Philosophy, Politics, and Economics at the University of Oxford from October 2024. I highly recommend an internship at MuSigmas for students in any subject domain who are interested in quantitative work.


